Tracing entire data flow
This lab will go over results of actions from the previous labs, validating messages from devices to broker and throughout the OpenWhisk ecosystem.
Exploring the AMQ Console
OpenShift supports accessing a user interface for the AMQ broker.
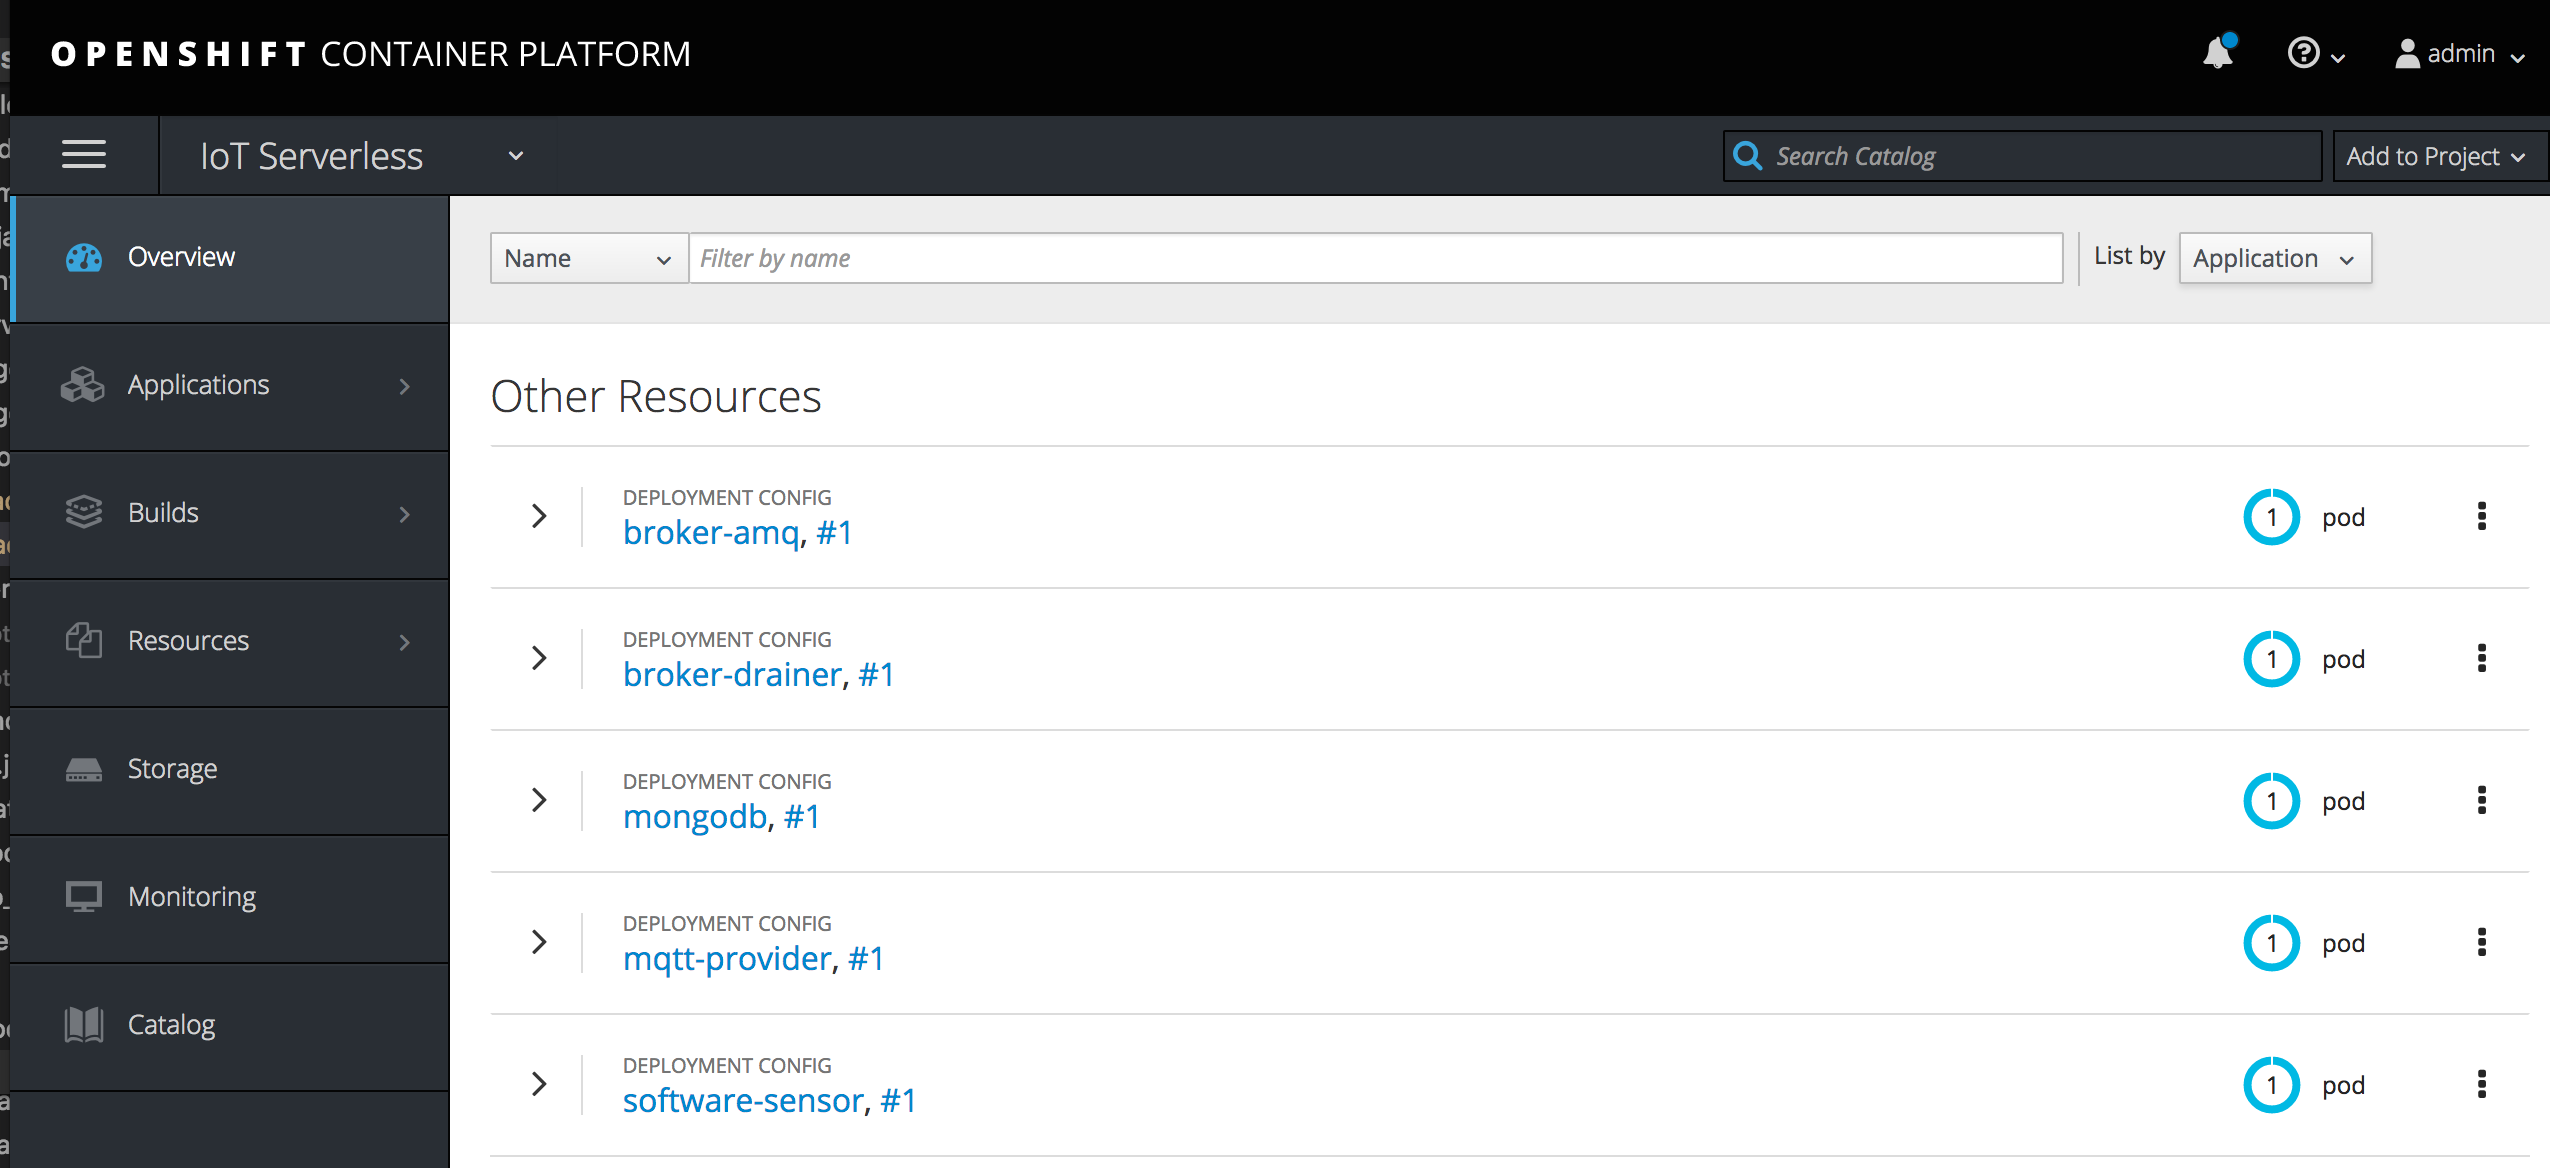
Select the iot-serverless project on the righthand side.
Click on the pod associated with the broker-amq deployment:
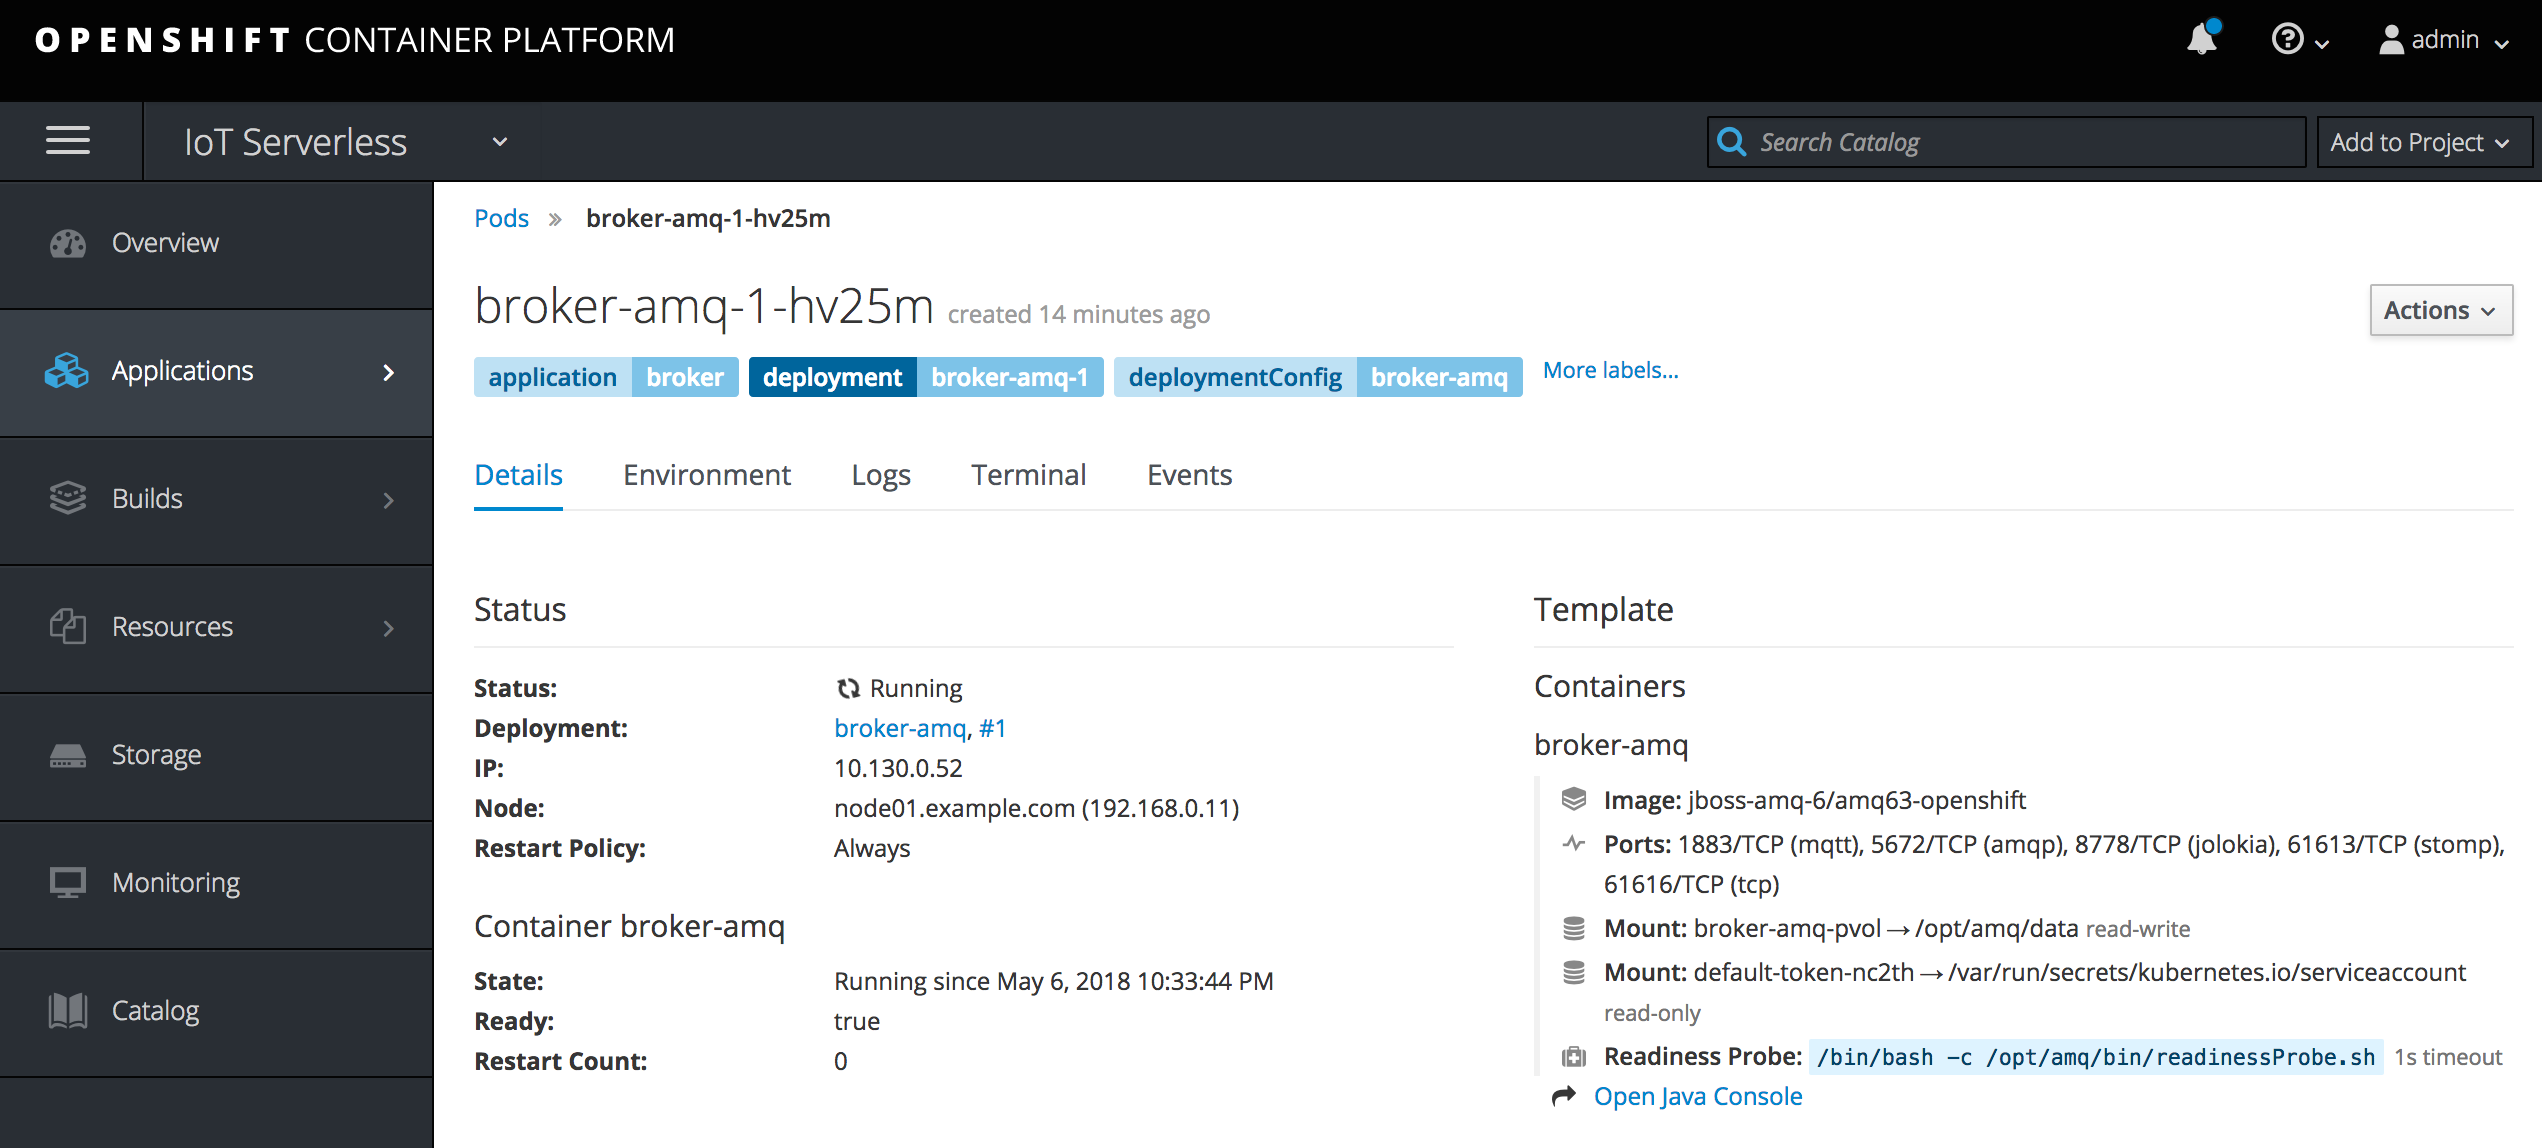
On the right side of the page under the broker-amq container, select Open Java Console
From the AMQ broker console, we can view a variety of metrics.
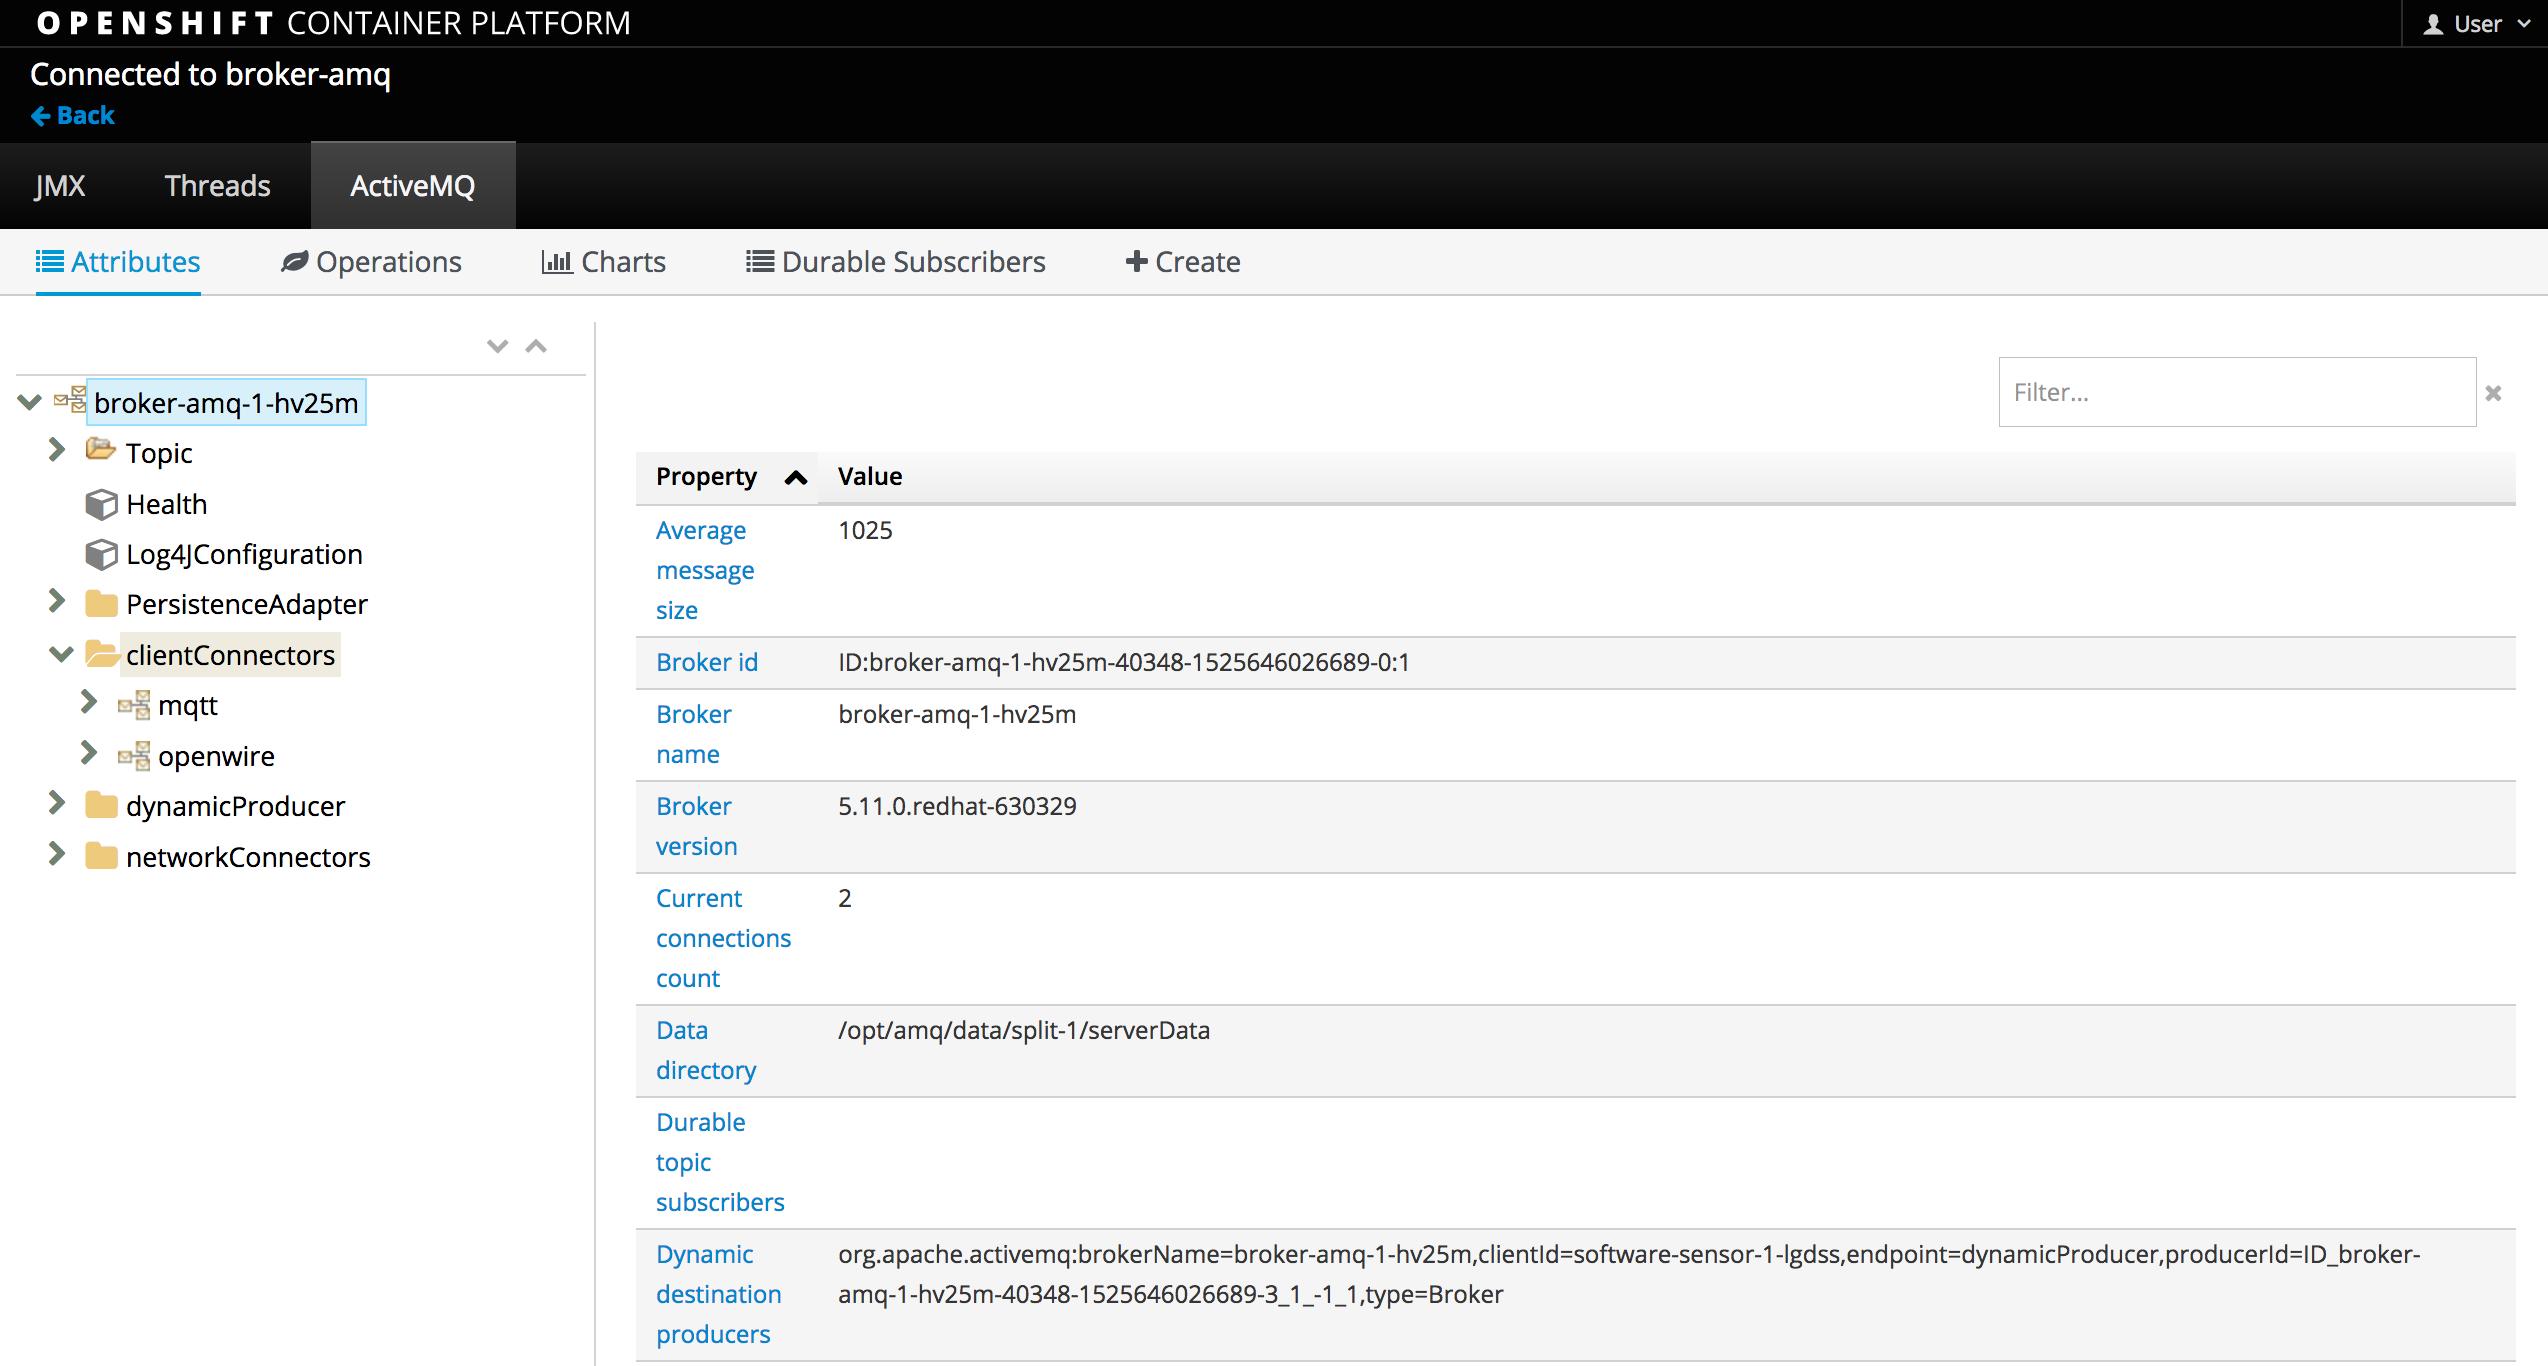
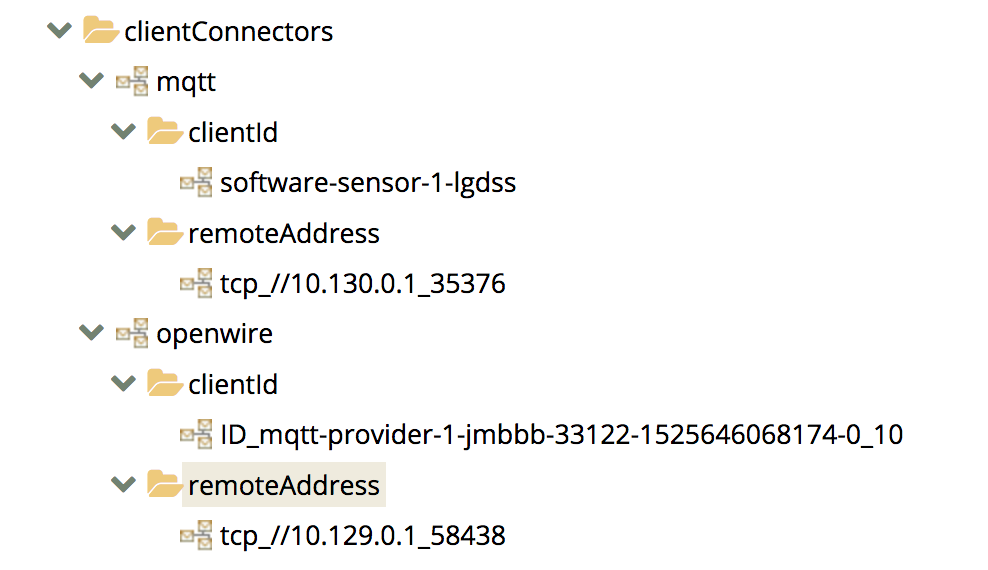
First, expand clientConnectors. You will notice two child objects, mqtt and openwire. The MQTT client is the simulated software that is transmitting IoT related telemetry. The OpenWire client is the OpenWhisk feed provider that is reading values from the broker and firing the trigger to execute the sequence action.
Next, expand Topic. Each IoT asset communicates on a topic starting with .sf. The JMS selector .sf.> is also present and if you expand the folder, you will see the mqtt-provider which confirms that the OpenWhisk feed was successfully registered to the broker through the feed provider.
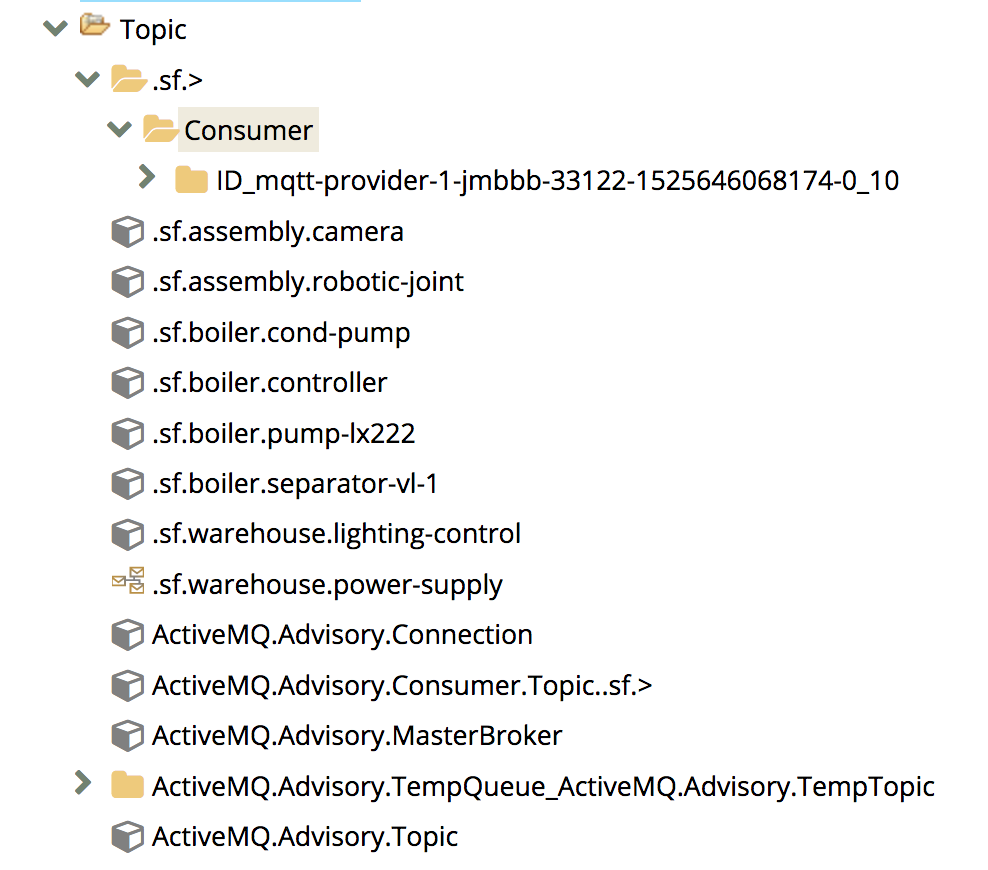
Now, select any one of the topics (starting with sf.) on the left hand side underneath the Topic dropdown. The various properties for the topic are displayed on the right side. Locate the Enqueue Count and Dequeue Count. They each should have a value greater than 0 and their values should also match. This represents that the broker received a certain number of messages from the IoT asset (Enqueue) and that the feed provider consumed a certain number of messages (Dequeue).
Verifying Messages Were Sent to OpenWhisk
In the previous section, we confirmed that the Feed Provider consumed the messages off of the topics, however, we should also confirm that those messages were then sent to the iotServerlessTrigger.
View the logs from the feed provider pod
 $ oc logs $(oc get pods -l=application=mqtt-provider -o 'jsonpath={.items[0].metadata.name}')

2018-05-06 23:23:52.645  INFO 1 --- [enerContainer-1] com.redhat.iot.service.OpenWhiskService  : About to Invoke: http://nginx.openwhisk.svc.cluster.local/api/v1/namespaces/_/triggers/iotServerlessTrigger
2018-05-06 23:23:52.656  INFO 1 --- [enerContainer-1] com.redhat.iot.service.OpenWhiskService  : Status: 202  Response body:{"activationId":"7912967ac688444192967ac688344197"}
A number of log messages similar to the output above should be seen (one for each message consumed off of the broker). As illustrated, the feed provider invoked an API endpoint in OpenWhisk for the trigger, and an HTTP 202 (Accepted) was returned. In addition, the activationId was also returned in a similar fashion to when we fired the trigger using the wsk CLI.
Viewing Results in the Database
At this point, OpenWhisk has accepted the request that was sent from the feed provider to the iotServerlessTrigger. Given that we have validated the sequence action previously, we should be able to skip right to the database and verify results have been persisted.
Obtain a shell session in the MongoDB pod by executing the following command:
$ oc rsh $(oc get pods -l=deploymentconfig=mongodb -o 'jsonpath={.items[0].metadata.name}') bash -c "mongo 127.0.0.1:27017/\${MONGODB_DATABASE} -u \${MONGODB_USER} -p \${MONGODB_PASSWORD}"

MongoDB shell version: 3.2.10
connecting to: 127.0.0.1:27017/iotserverless
Welcome to the MongoDB shell.
For interactive help, type "help".
For more comprehensive documentation, see
	http://docs.mongodb.org/
Questions? Try the support group
	http://groups.google.com/group/mongodb-user
>
Finally list the rows in the results table
> db.results.find()The entire end to end flow is validated if records are returned.
Exit out of the MongoDB shell and pod.
![]()
![]()
![]()